
Know what your investments are really worth.
AI fair value estimates, 30+ years of SEC data, and brokerage sync across 35+ brokerages.
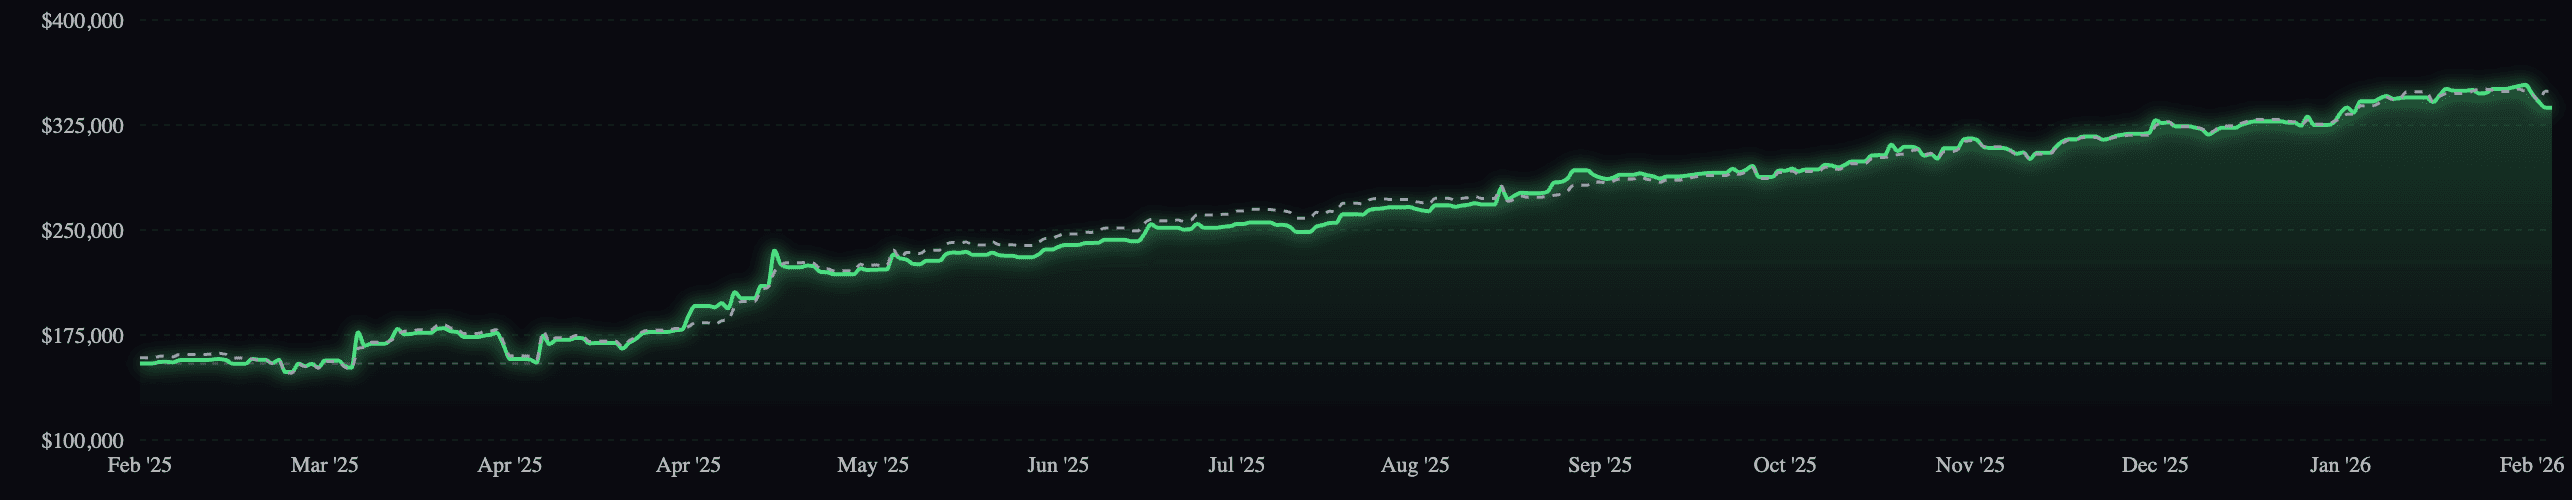
Scattered data, one clear picture
Firestock connects your brokerages and turns scattered holdings into a unified dashboard with real-time performance, dividends, and AI-powered analysis.
Portfolio
Overview of your investment portfolio
Total Value
$484,581
Total P&L
+$78,572
Positions
42
Annual Dividends
$3,480
Portfolio Performance
VFIAX
$547.23
$227,934
47.0%
GOOGL
$196.02
$26,354
5.4%
AAPL
$278.12
$22,249
4.6%

Intelligence built into every analysis
Know if a stock is over or undervalued
Our 3-model ensemble combines discounted cash flow analysis, relative valuation multiples, and AI sentiment scoring to deliver a single fair value estimate for every stock.
- Combines DCF, relative valuation, and AI sentiment
- Adjusts for sector-specific risks
- Updates with each earnings report
Fair Value Estimate
Conservative
$105.66
Base Case
$190.60
Optimistic
$302.45
Bear
$142
-49%
Base
$198
-29%
Bull
$310
+11%
Apple trades at a significant premium to our DCF-derived fair value, driven by strong ecosystem lock-in and services growth. Current multiples price in aggressive growth.
Key Drivers
- + Services revenue growth
- + Ecosystem lock-in
- + Strong FCF generation
Key Risks
- - Smartphone saturation
- - China revenue decline
- - Regulatory headwinds
Every stock, scored across 8 fundamental dimensions
Go beyond simple P/E ratios. Our Deep Alpha Score evaluates profitability, balance sheet health, growth, valuation, earnings quality, management effectiveness, analyst consensus, and market sentiment.
- 8 fundamental dimensions in one score
- Star rating for quick comparison
- Backtested against 30+ years of data
Deep Alpha Score
Strong profitability metrics with excellent balance sheet health. Growth trajectory remains robust despite premium valuation multiples.
Identify companies with lasting competitive advantages
Great companies have moats that protect their earnings. We score each stock across 5 criteria used by professional value investors to identify durable competitive advantages.
- Pricing power and switching cost analysis
- Network effects and scale advantages
- Intangible assets like brands and patents
Moat Assessment
Moderate Moat
3.9
/5
Apple's ecosystem creates powerful switching costs, with seamless integration across devices driving retention. Pricing power remains strong in premium segments, though hardware commoditization poses long-term risks.

Track your path to financial independence
Sophisticated FIRE calculators, dividend projections, and progress tracking — everything you need to plan your early retirement.
- Accumulation & withdrawal calculators
- Dividend income projections
- Progress tracking with milestone alerts
- Monte Carlo simulations
FIRE Progress
FIRE Number
$2.1M
Current
$1.43M
Years remaining
12
Monthly savings
$4,200
Projected Income at FIRE
Annual
$84,000
Monthly
$7,000
SWR
4%

Deep dividend analytics for income investors
Track dividend income across your entire portfolio, project future payouts, and identify the best dividend stocks with comprehensive screening.
- Per-stock and portfolio-level dividend tracking
- Ex-date calendar with upcoming payments
- Dividend growth rate analysis
- Payout ratio and sustainability scoring
Dividend Intelligence
This month
$847
Annual Total
$4,847
Investment Ideas
AI-generated briefings on the world's most interesting companies.

AAPL: The Services Revolution
How Apple's recurring revenue shift is transforming its valuation story.
Read briefing
NVDA: The AI Infrastructure Bet
Data center dominance and the next wave of GPU-driven growth.
Read briefing
GOOGL: Search Meets AI
Defending the core while building the next computing platform.
Read briefing
AMZN: Cloud-First Commerce
AWS margins vs. retail efficiency: the dual engine powering Amazon.
Read briefing
META: The Engagement Machine
Reels momentum and the path to monetizing the metaverse.
Read briefing
MSFT: Enterprise AI Leader
Copilot integration and Azure growth define Microsoft's next era.
Read briefing
AMD: The GPU Challenger
Closing the AI chip gap with competitive pricing and enterprise wins.
Read briefing
NFLX: Streaming Profitability
Ad-supported tiers and password sharing crackdowns driving margin expansion.
Read briefing
Powered by institutional-grade data
Tiingo
Real-time & historical prices
SEC EDGAR
Official company filings
SnapTrade
Secure brokerage sync
FMP
Financial fundamentals
12data
Crypto & forex data
Stocks Analyzed
Years of Data
Brokerages
Features
Bank-level encryption. Read-only OAuth. Your credentials are never stored. We can never make trades or transfers on your behalf.

Built for investors who take it seriously.
Pricing
Start free, upgrade when ready.
No credit card required. Try everything for 14 days.